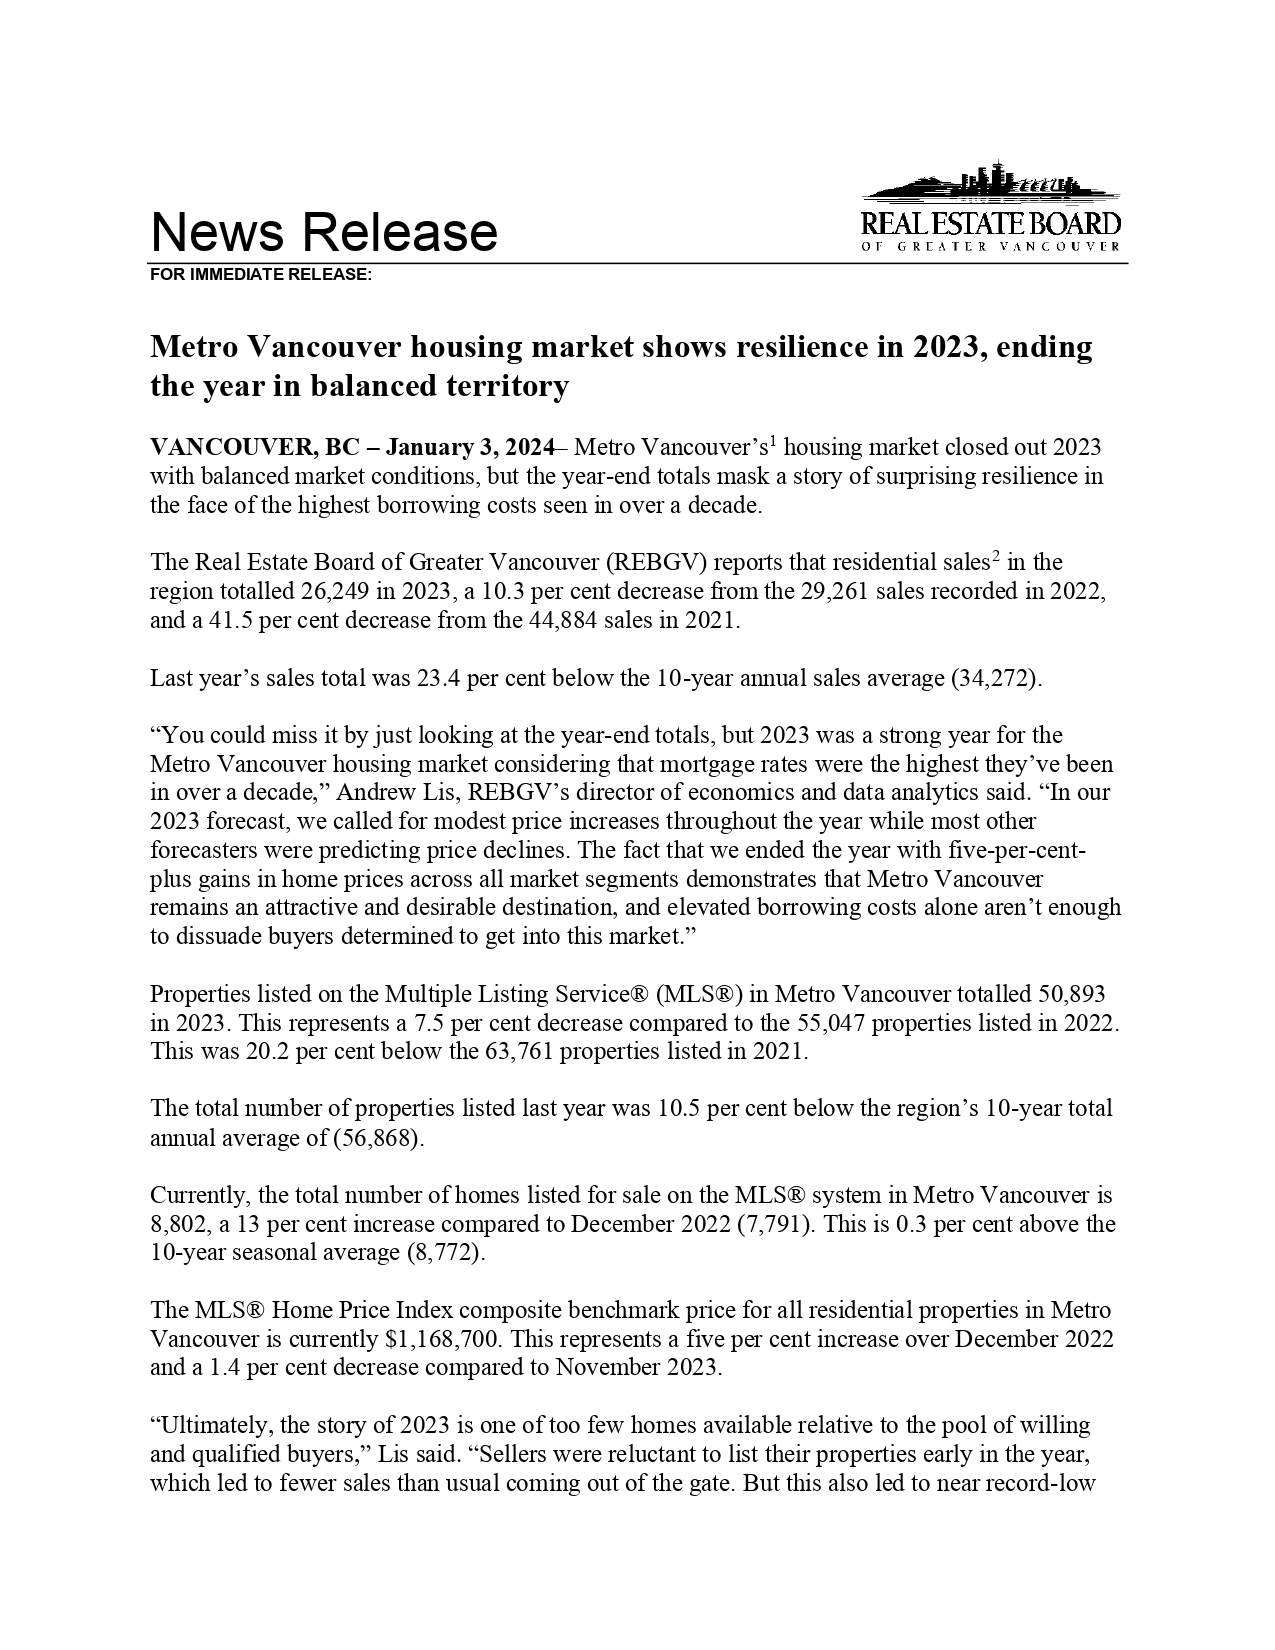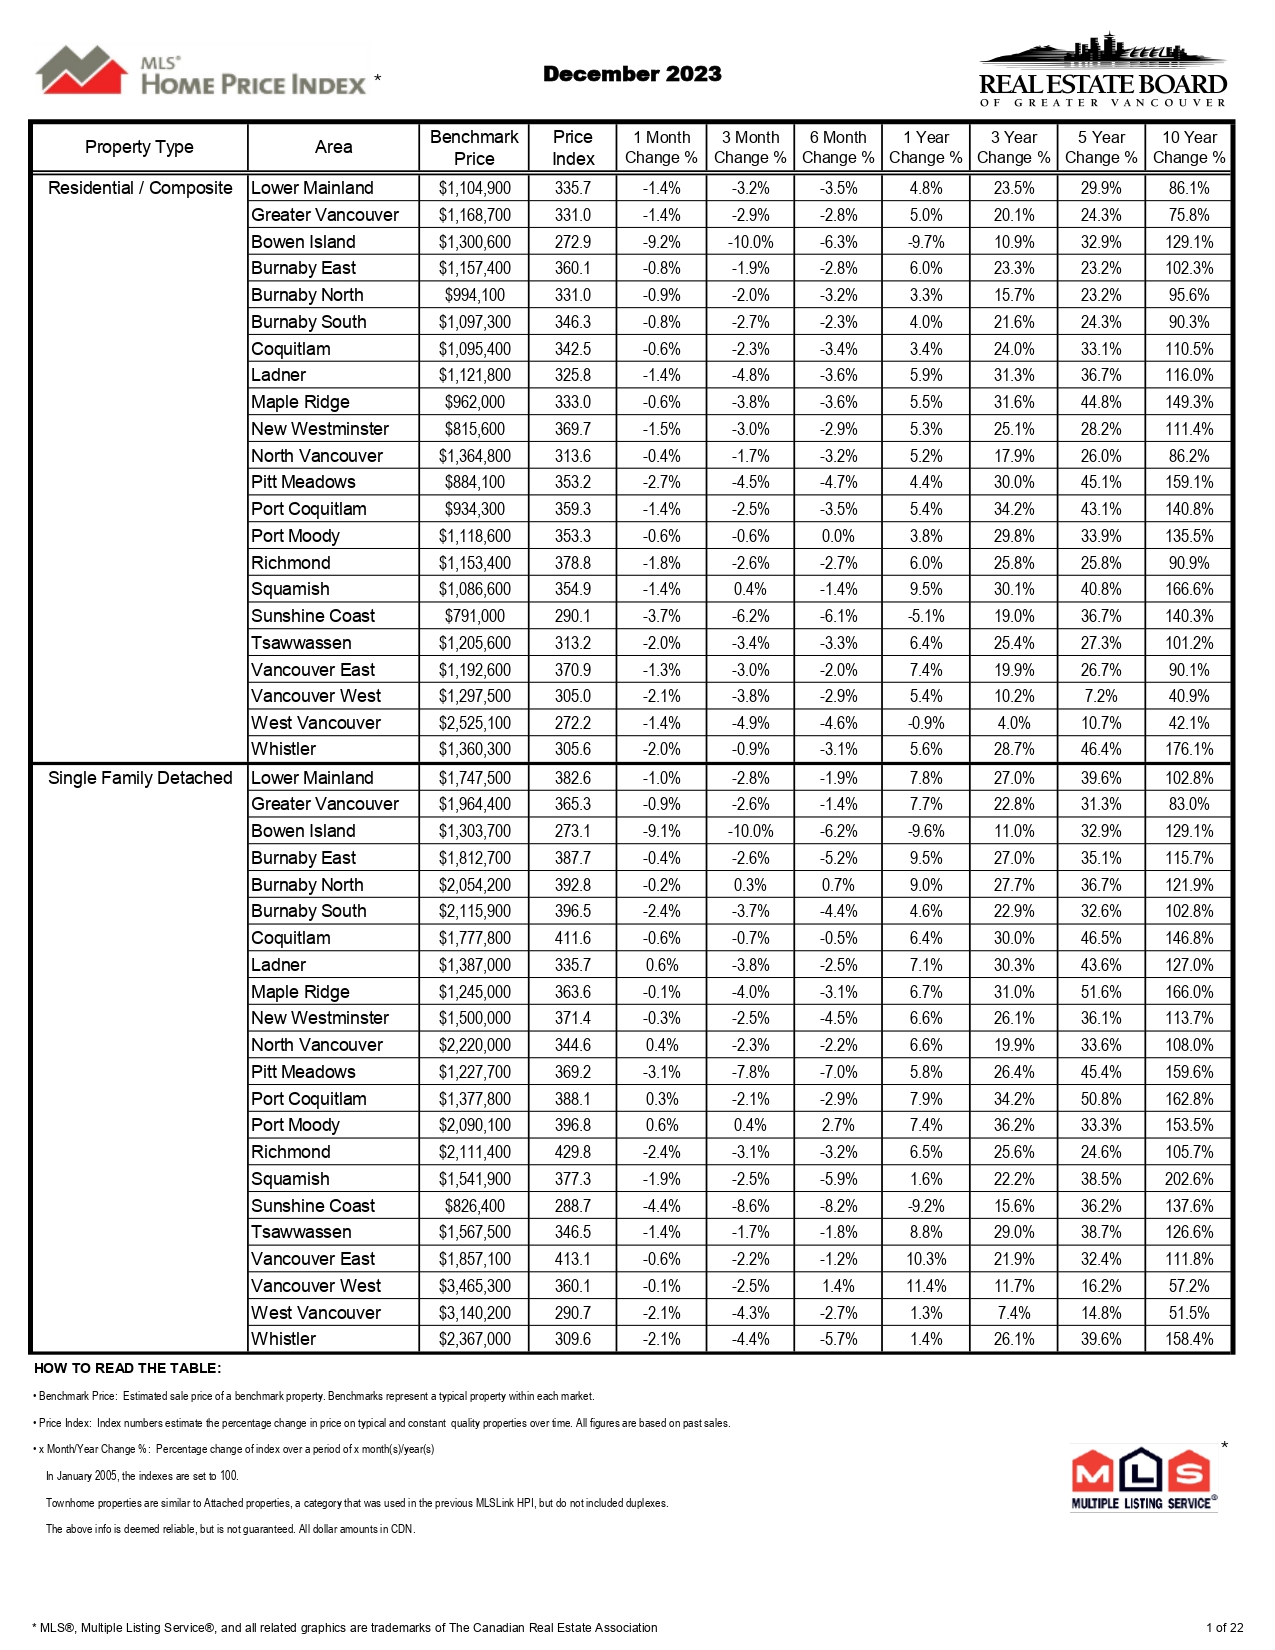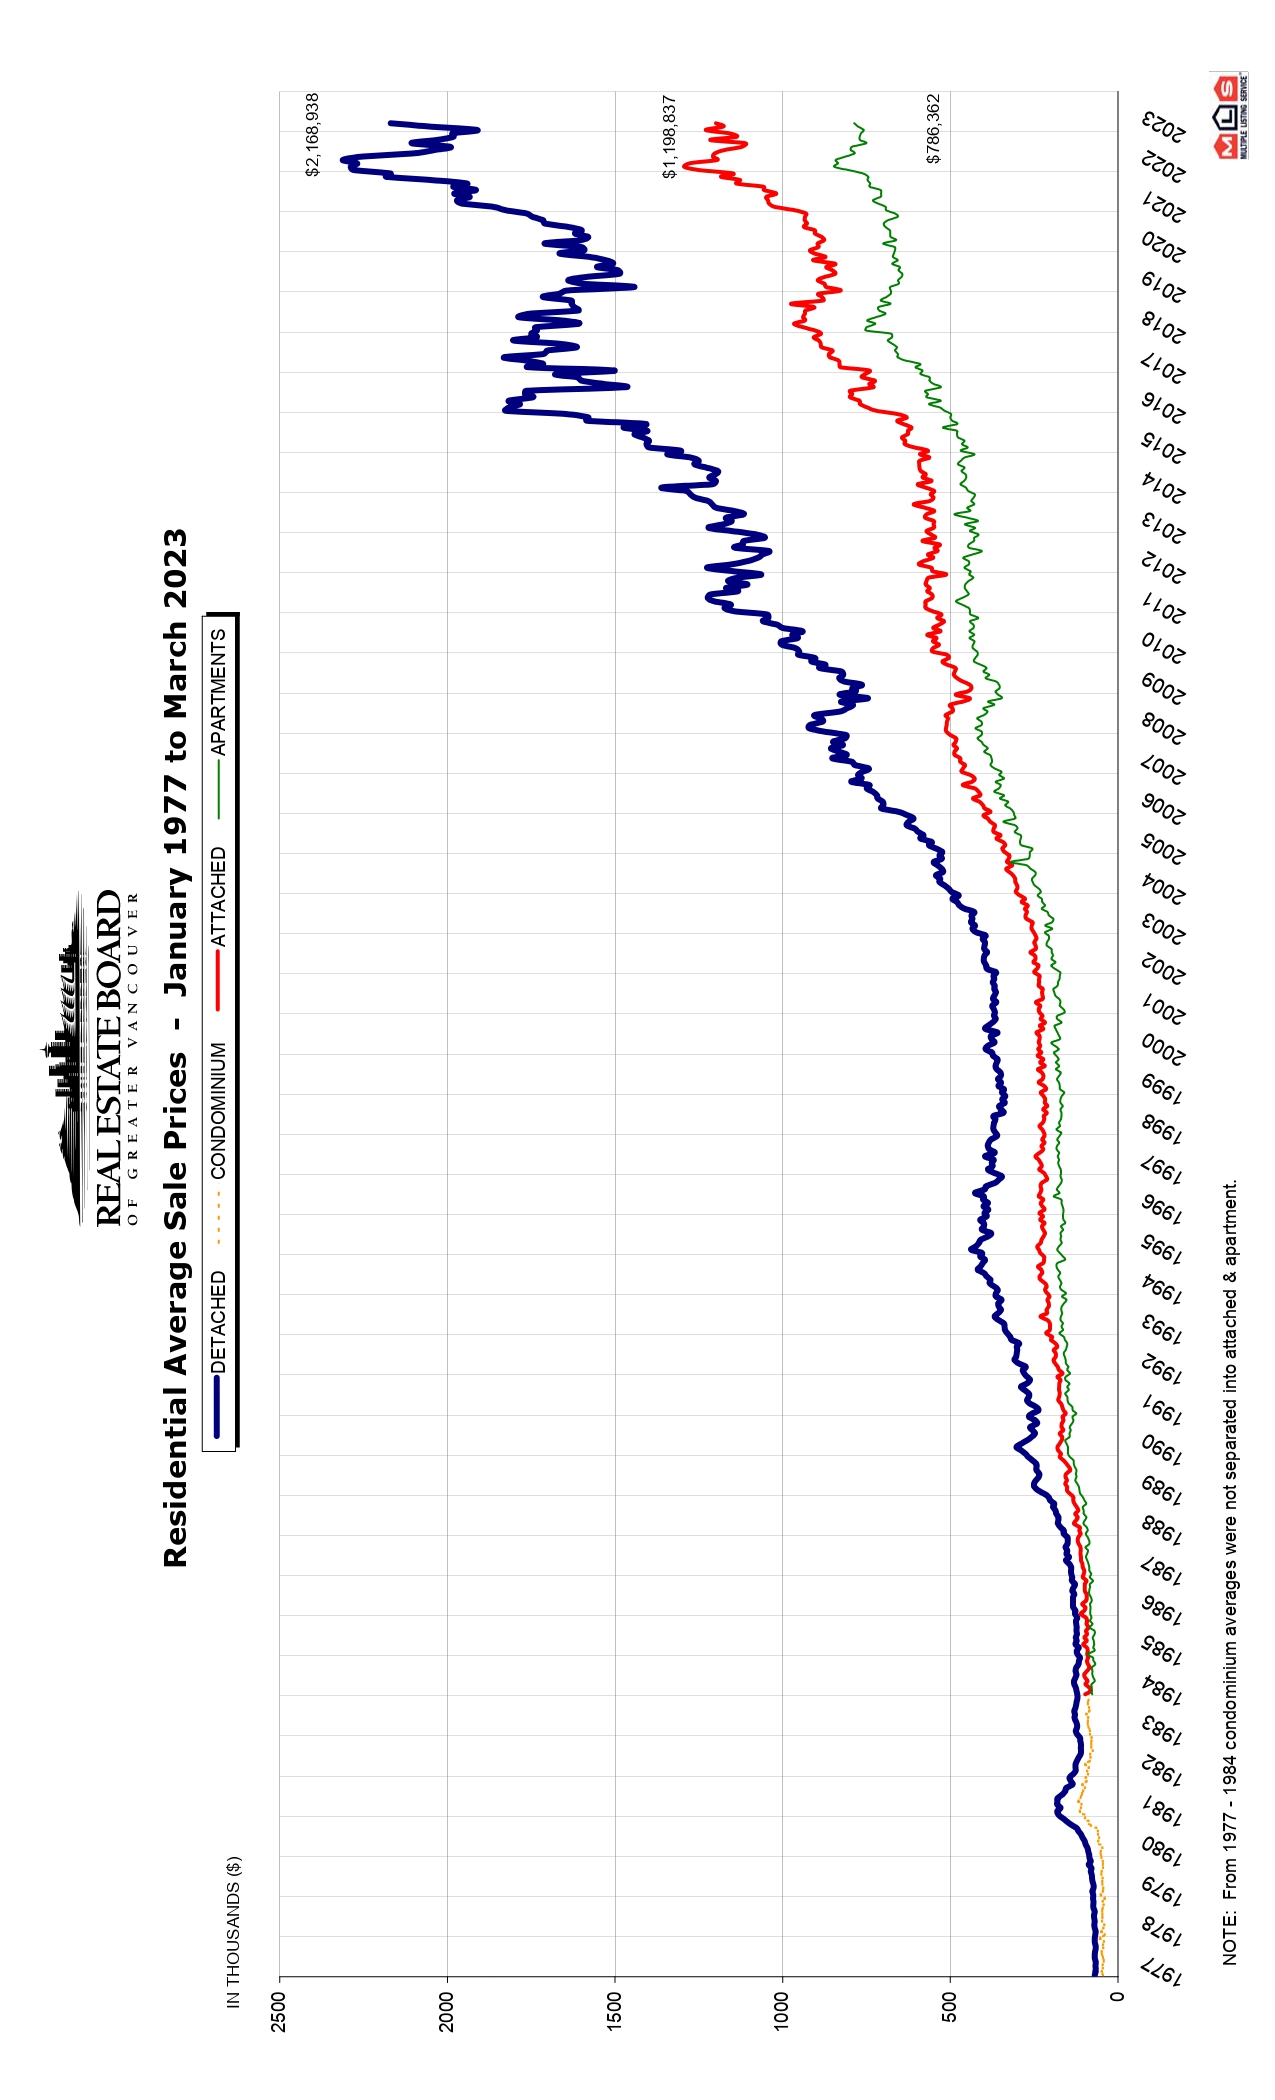
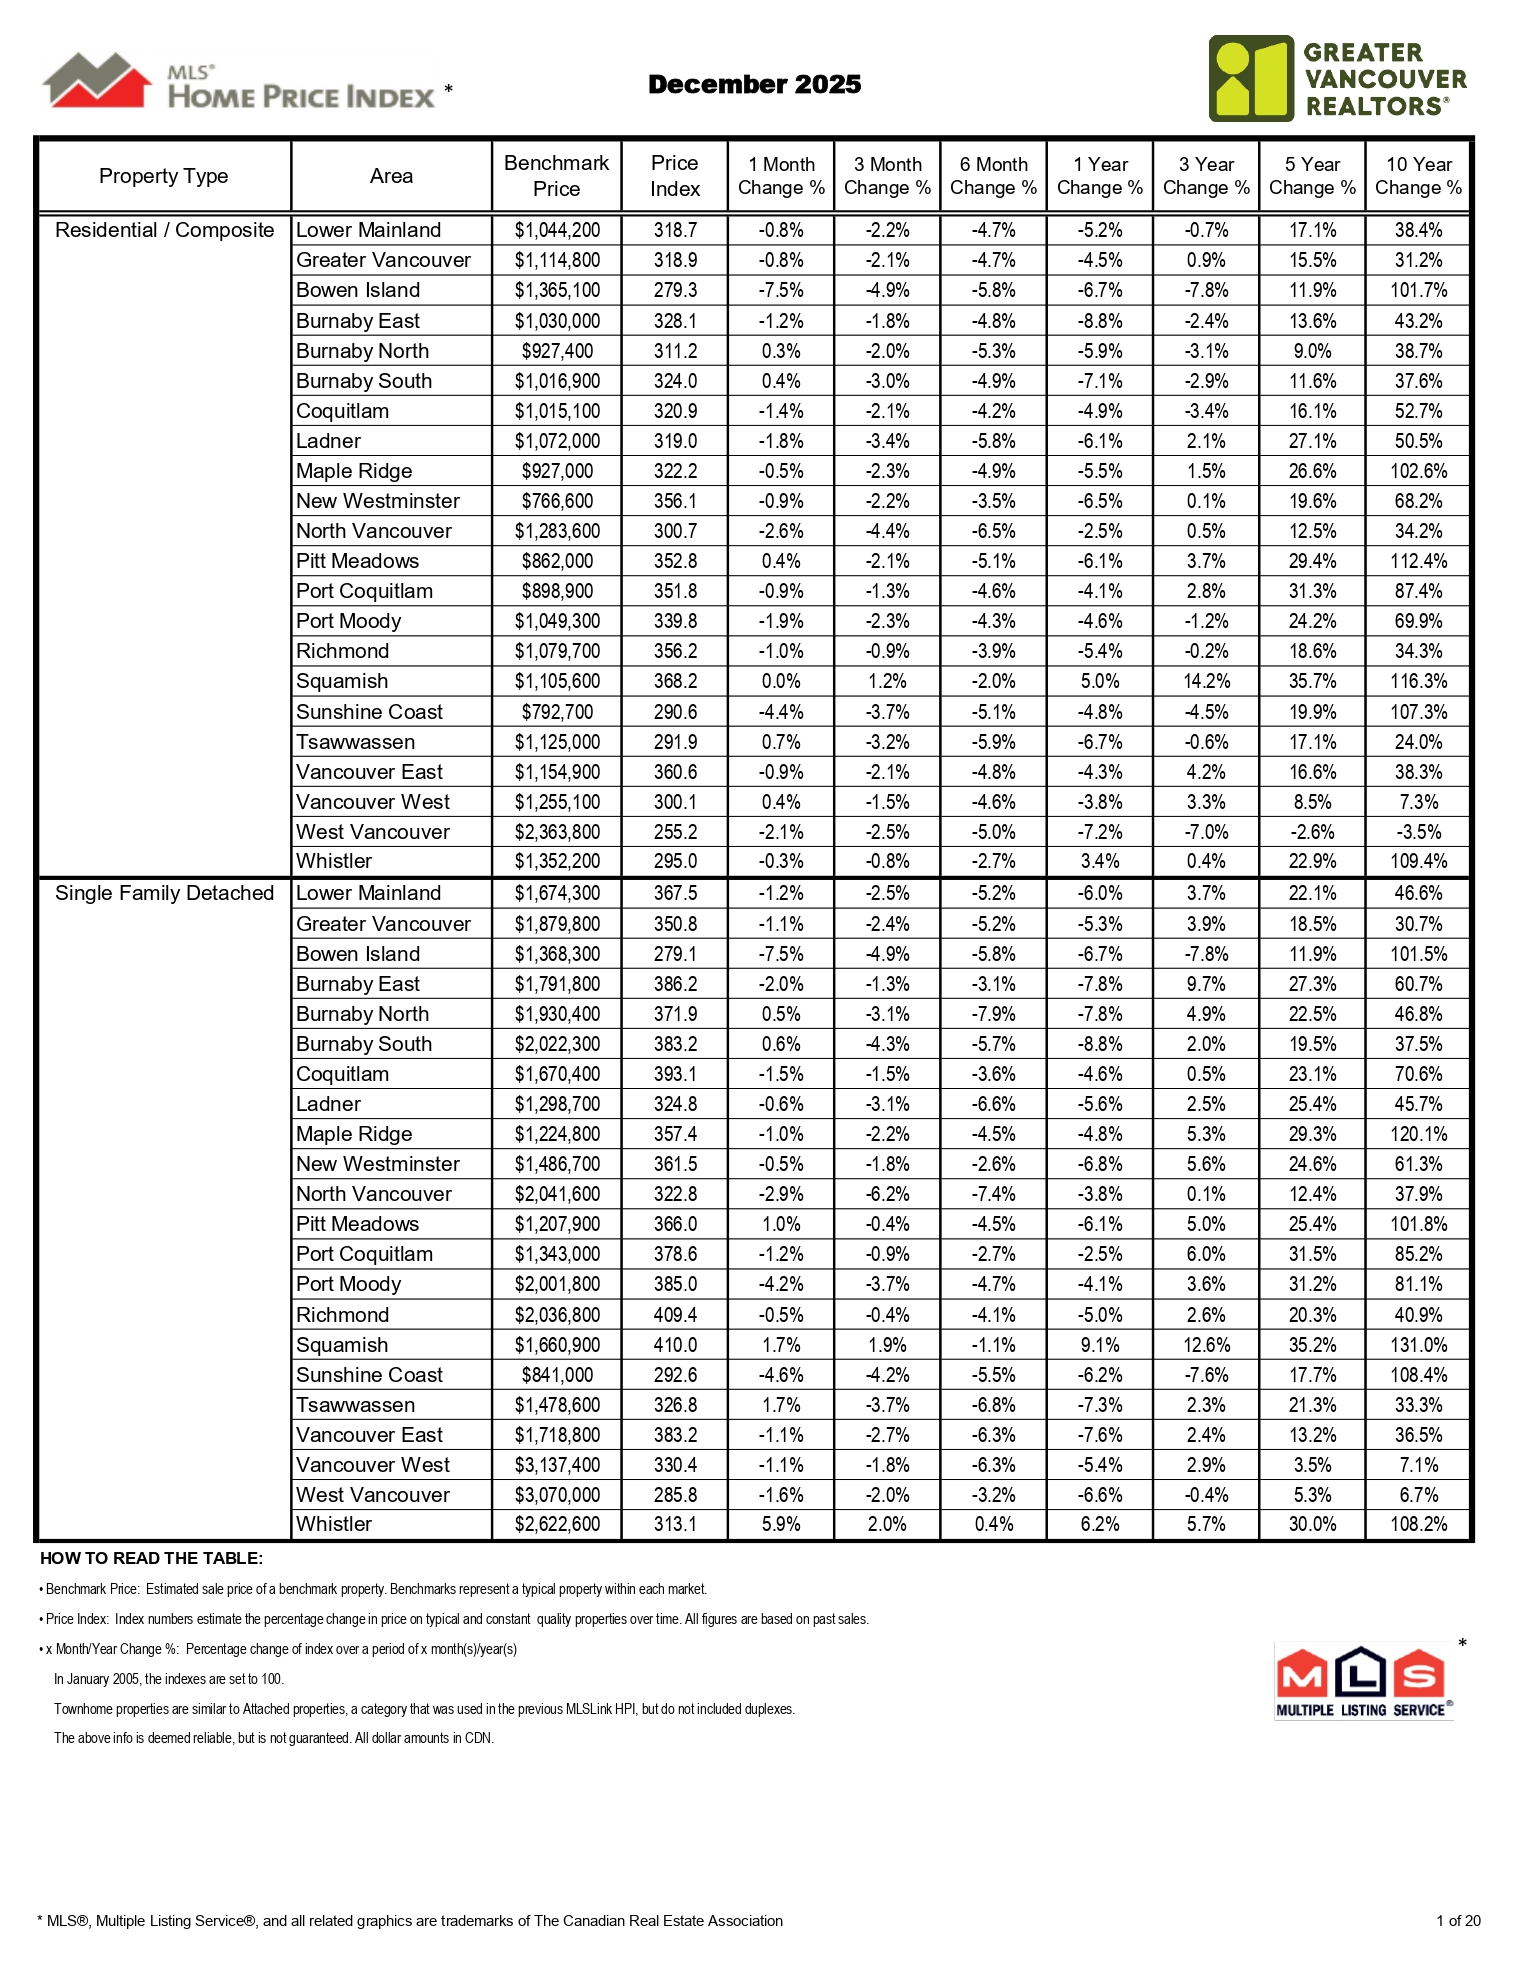
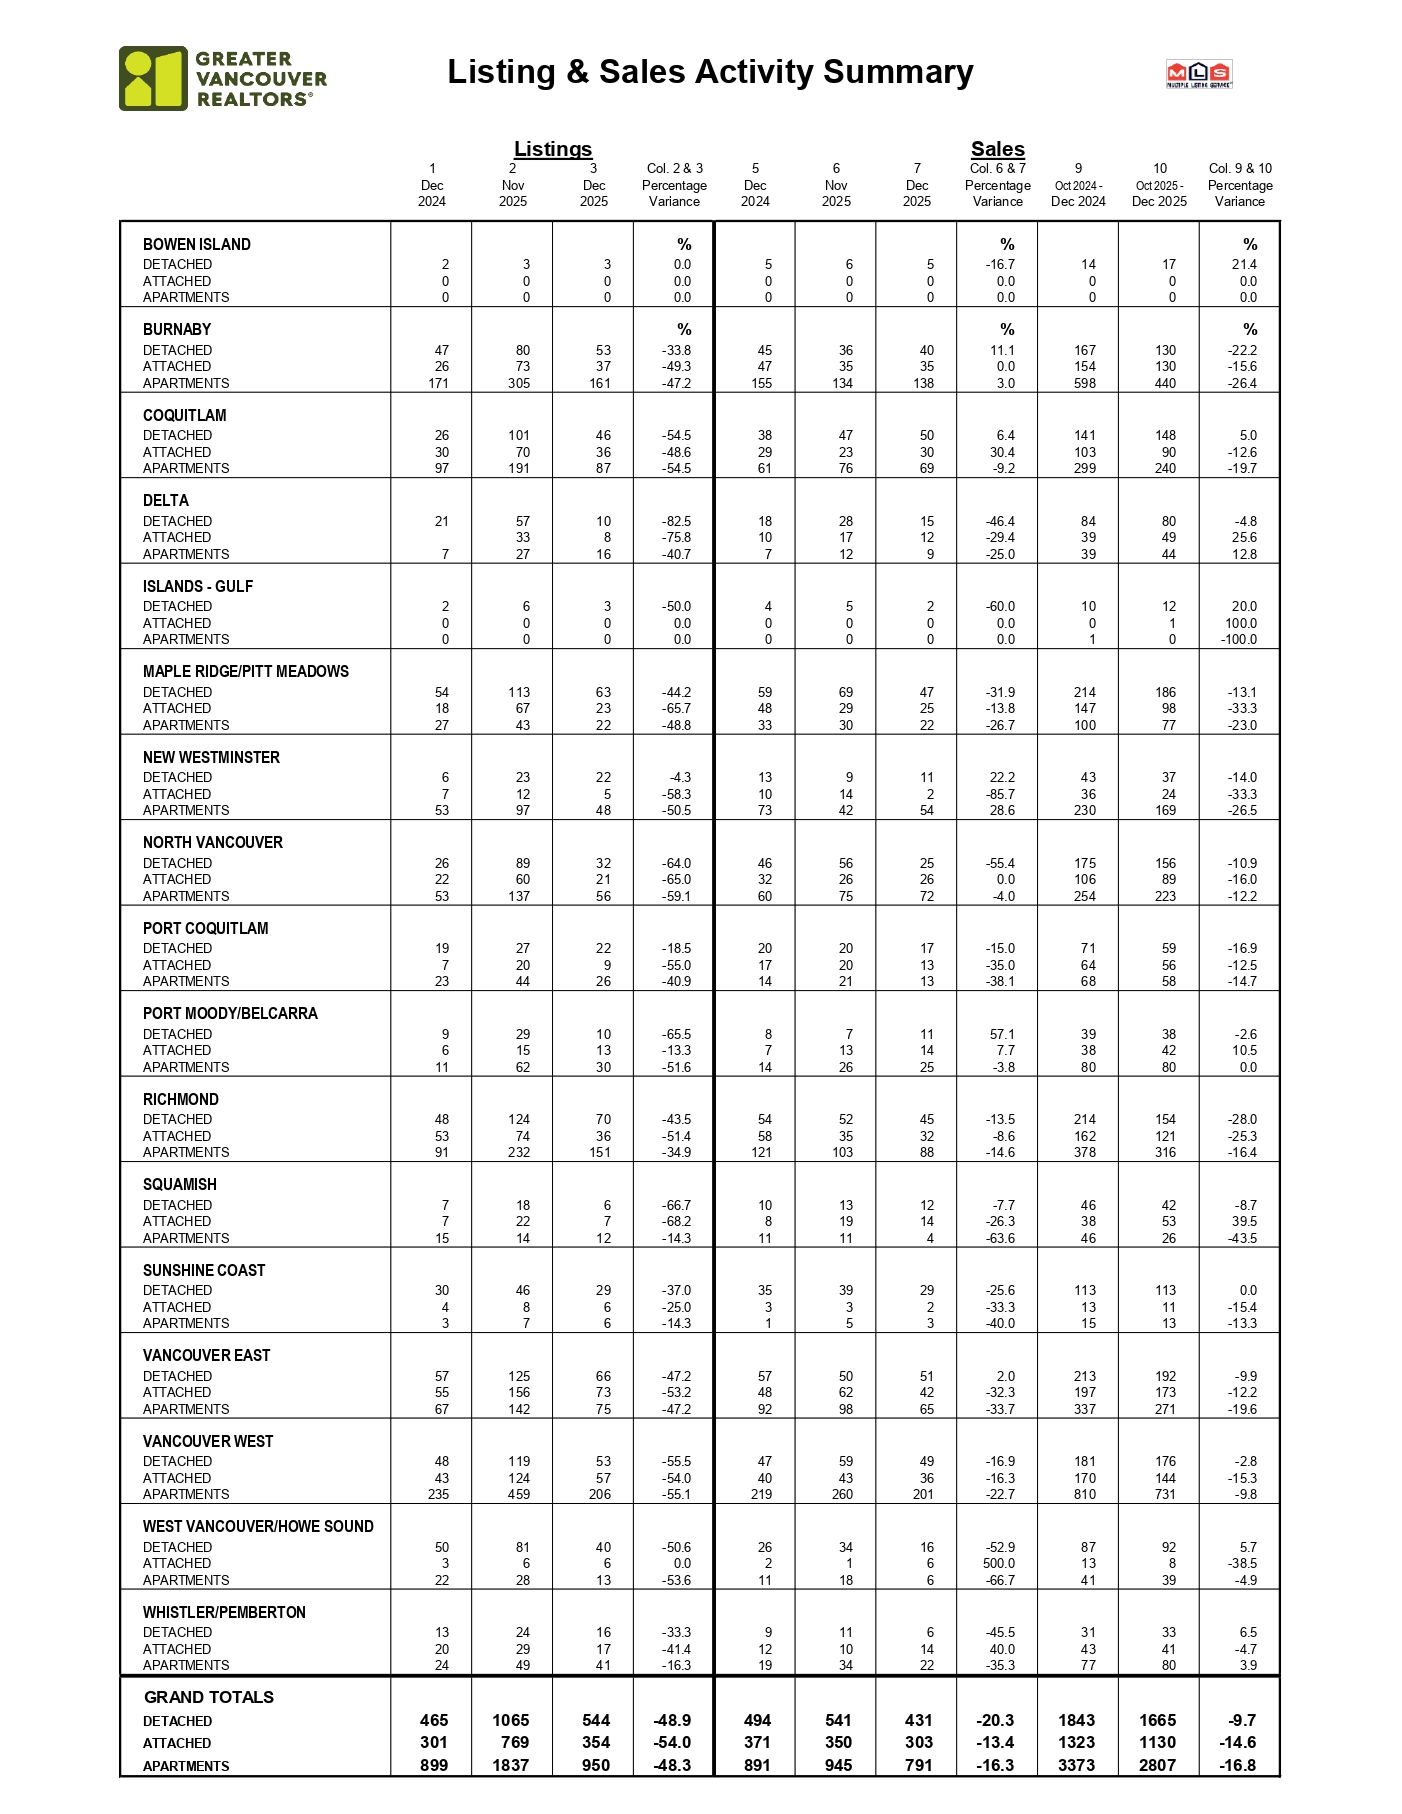
Home sales registered in the Multiple Listing Service® (MLS®) in Metro Vancouver* finished the year down 10 per cent, marking the lowest annual sales total in over twenty years.

![]() The data relating to real estate on this website comes in part from the MLS® Reciprocity program of either the Real Estate Board of Greater Vancouver (REBGV), the Fraser Valley Real Estate Board (FVREB) or the Chilliwack and District Real Estate Board (CADREB). Real estate listings held by participating real estate firms are marked with the MLS® logo and detailed information about the listing includes the name of the listing agent. This representation is based in whole or part on data generated by either the REBGV, the FVREB or the CADREB which assumes no responsibility for its accuracy. The materials contained on this page may not be reproduced without the express written consent of either the REBGV, the FVREB or the CADREB.
The data relating to real estate on this website comes in part from the MLS® Reciprocity program of either the Real Estate Board of Greater Vancouver (REBGV), the Fraser Valley Real Estate Board (FVREB) or the Chilliwack and District Real Estate Board (CADREB). Real estate listings held by participating real estate firms are marked with the MLS® logo and detailed information about the listing includes the name of the listing agent. This representation is based in whole or part on data generated by either the REBGV, the FVREB or the CADREB which assumes no responsibility for its accuracy. The materials contained on this page may not be reproduced without the express written consent of either the REBGV, the FVREB or the CADREB.